The action: Create a scoreboard that will tell you at a glance whether you are winning
The long form: If someone comes to visit your workplace and asks “How are you doing? Are you reaching your targets?”, would everyone know what to look for?
In addition to visual tools that improve people’s work, you could also create visual scoreboards that show progress for the entire team. The aim here is for everyone to be able to quickly answer the question, “How are we doing?”
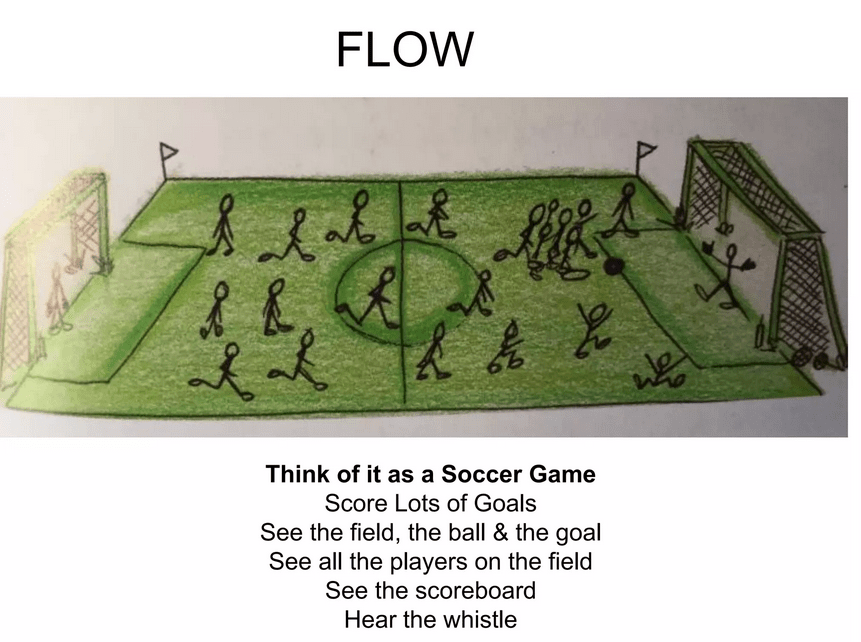
For each of your most important goals, try to make a scoreboard so everyone can see how your are doing. Just as a football match becomes more engaging if you keep score, work becomes more interesting when you know if you are making progress on it. People just play differently when keeping score.
The ideal scoreboard is a) made by the people who use it, and b) a mix of leading and lagging indicators. Lagging indicators are the outcomes of your actions, but the leading indicators are where you can influence the score.
While a lag measure tells you if you’ve achieved the goal, a lead measure tells you if you are likely to achieve the goal.
Chris McChesney, The four disciplines of execution
A lagging indicator may be revenue per month, and its leading indicator could be the number of sales calls we have made.
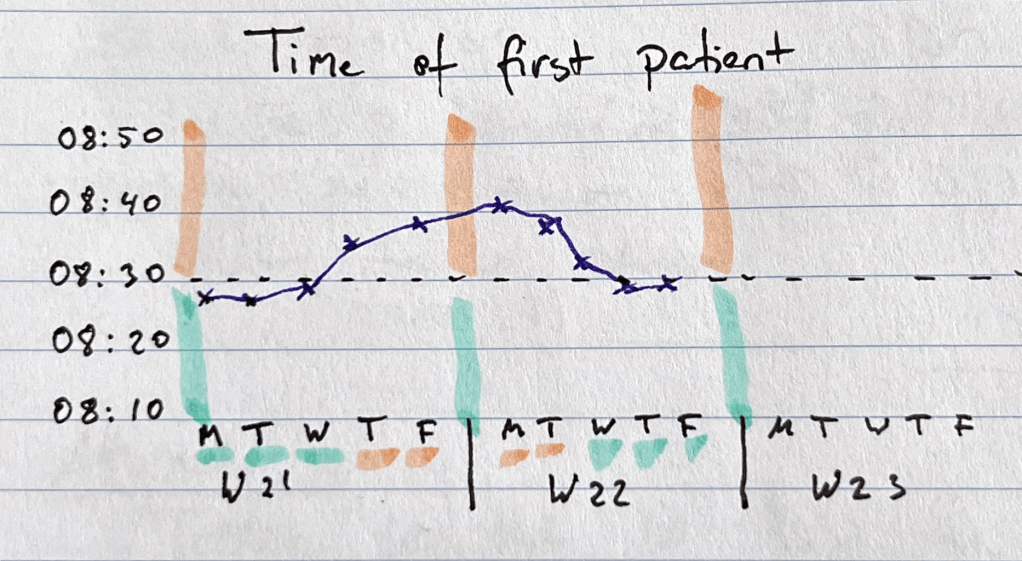
In one clinic we worked on, the aim was to reduce overtime and create a more stable workload (lagging indicator). An important leading indicator was the time of first treatment – because a stable start of the day was the best way to get a stable rest of the day. We made a simple hand-drawn graph to see how many days we managed to start at 08:30, and posted it on a wall so everyone could see how we were doing.
Read more:
Chris McChesney on the Four Disciplines of Execution.
First forty: Separate signal from noise in your data
